Key recent narrative developments in SATS and Unisats
In the next two months at least, SATS will be one of the targets worthy of special attention in the BTC ecosystem. This article will review and sort out the changes in SATS.
 JinseFinance

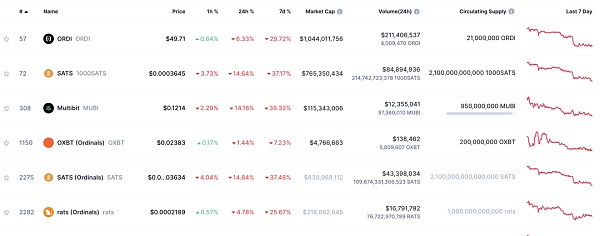
Since 2024, the performance of Inscription tokens ORDI and SATS has lagged relatively behind the overall cryptocurrency market and is showing signs of possible further decline.
In January, the entire cryptocurrency market experienced significant declines in multiple digital assets, including the most affected Inscription Token (also known as BRC -20 tokens) ORDI and SATS.
The lackluster performance of these unique coins is not only influenced by Bitcoin's recent price fluctuations, but also by several other key factors.
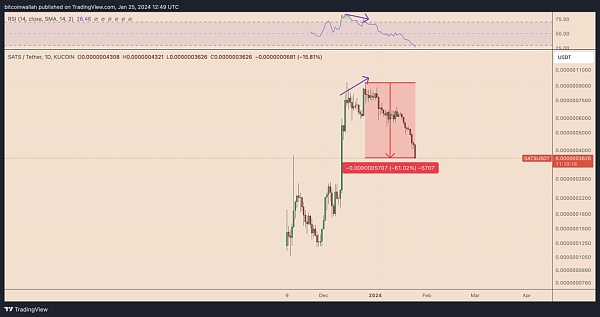
It is worth noting that , as of now in 2024, the prices of ORDI and SATS have experienced approximately 34.50% and 50% declines respectively.
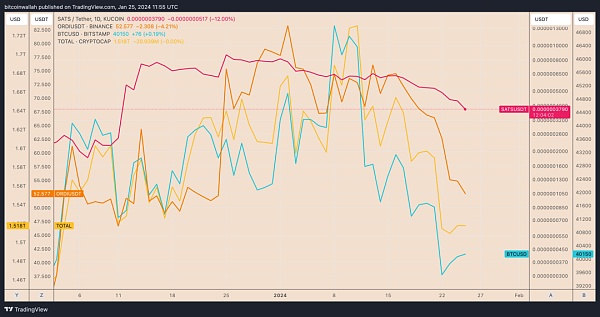
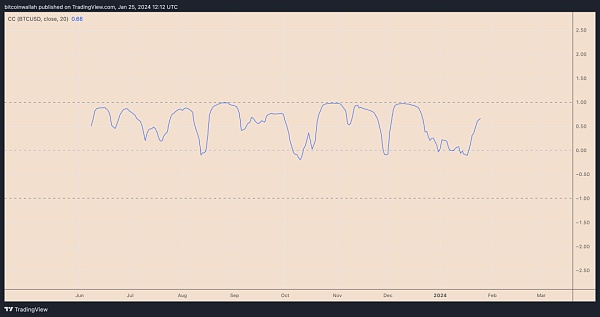
The main reason for this decline is that the entire cryptocurrency market, especially the market led by Bitcoin, is permeated by a "selling news" sentiment. As of January 25, ORDI’s correlation coefficient with BTC reached 0.66, which has remained positive in recent history.
In addition to this, this downward trend is consistent with a significant reduction in inscription fees and Bitcoin block size shares, highlighting the weakening demand for Bitcoin ordinal numbers .
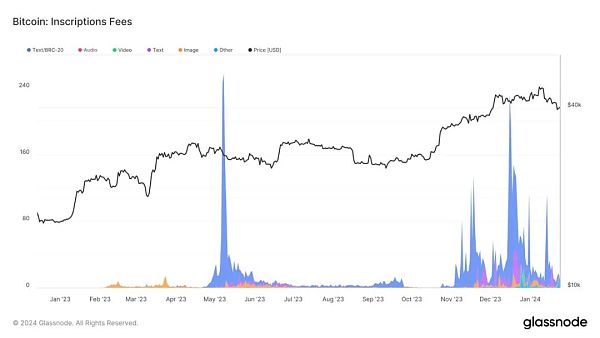
The price trend of Inscription tokens is often closely related to BTC, mainly because the Bitcoin ordinal number is directly dependent on Bitcoin’s blockchain. For example, ORDI’s operations involve writing data directly to the Bitcoin blockchain, creating a unique form of digital artifact that exists within Bitcoin transaction outputs.
In addition to broader market trends , a key factor in the recent decline in ORDI and SATS prices is the emergence of bearish divergence signals.
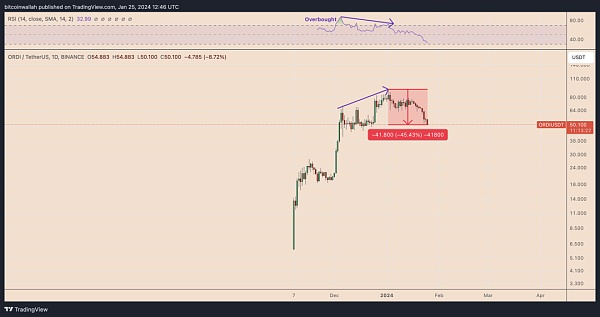
Take ORDI as an example. Its daily chart with USDT showed a typical bearish divergence pattern from December 5, 2023 to January 2, 2024. Simply put, ORDI’s price is forming higher highs, but its relative strength index (RSI) is showing signs of heading lower.
The subsequent 45% retracement is consistent with a bearish divergence signal, where the divergence between RSI and price action precedes a correction in price.
Similarly, for SATS, its price experienced a bearish divergence signal of rising price and falling RSI in an uptrend, resulting in a decline of more than 60%.
Overall, the bearish divergence on the ORDI and SATS charts is worth watching for traders as it hints at a potential trend reversal, or at least the current one. A temporary break in an uptrend.
In the next two months at least, SATS will be one of the targets worthy of special attention in the BTC ecosystem. This article will review and sort out the changes in SATS.
JinseFinanceShiba Inu launches SHEboshis NFTs on ERC-404, enhancing liquidity and ownership, despite a minting bug resolved by increasing supply.
 Sanya
SanyaOn February 1st, the Binance Web3 wallet was launched on the Inscription Market. Users can manage their BRC-20 assets. The performance is unsatisfactory. However, the competition in the Bitcoin ecosystem in 2024 is destined to become a roadblock between large institutions such as Binance and OKX. Long-term narrative.
JinseFinanceBinance unveils "Inscriptions Marketplace" for seamless trading and minting of BRC-20 and EVM tokens. Integration with Binance Web3 Wallet enhances user experience, reinforcing Binance's position in the cryptocurrency ecosystem.
 Edmund
Binance launches the Inscriptions Marketplace, revolutionizing crypto trading by enabling users to buy, sell, and mint tokens, backed by strategic partnerships and a focus on innovation.
 Weiliang
Judging from the current market value rankings, ORDI and SATS are the undisputed leaders and second-tier players in BRC-20.
JinseFinanceThe addition of many myths of wealth and the continuous influx of capital have made inscriptions even more popular. Recently, as the market value of Bitcoin has heated up, the popularity of inscriptions has also reached a fever pitch.
JinseFinanceHit 10 billion MOVEs in three days! Is the MRC-20 "Smart Inscription" a hit? Does the inscription open a new narrative?
JinseFinanceInscription, why am I becoming more and more optimistic about Inscription? Golden Finance, why did my attitude towards the inscription take a sharp turn?
JinseFinanceBeyond its financial transactions, Bitcoin's blockchain holds hidden messages and inscriptions that add a layer of personalization and expression. This article explores the significance of inscriptions on the Bitcoin blockchain, from identifying senders to embedding codes and expressing opinions. Delve into famous inscriptions like the genesis block message and the hexadecimal code linked to WikiLeaks. Discover how the blockchain becomes a canvas for tributes, political statements, and historical markers, making it more than just a ledger of transactions.
 Bernice