Source: Checkmate, Glassnode; Compiler: Deng Tong, Golden Finance
Abstract:
Since supply peaked in November 2023, long-term holders have spent approximately 300,000 BTC. More than half of this reflects GBTC outflows.
With the market trading at multi-year highs above $50,000, loss-making supply is shrinking to just 13% of the global total.
From a short-term holder's perspective, the January-February ETF sell-off news correction had many of the characteristics of a classic "bull market correction."
Reducing supply
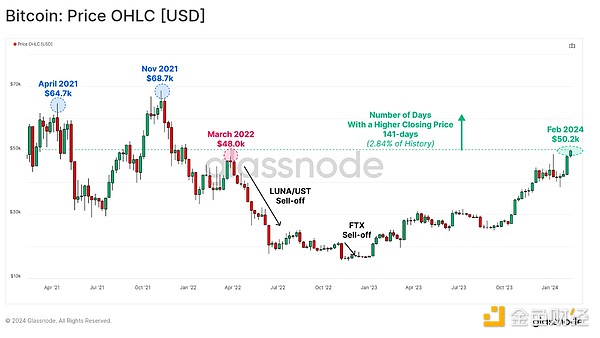
Bitcoin investors continue to enjoy a positive and strong year, with the Bitcoin market trading at a new multi-year high of $50,200 , with a year-to-date return of +18.5%. In 2021, there were only 141 daily closes above $50,200, accounting for just 2.84% of Bitcoin’s trading history.
Bitcoin has also risen 130% in the past 12 months since the November 2022 lows It's up more than 207% and is currently trading just 28.6% below its peak. As the market gets closer to the 2021 highs, there is less and less supply of BTC costing above this level.
This leaves the vast majority of investors and the supply they hold in profit, bringing the market closer to another transitional phase where long-term holders begin to take chips off the table.
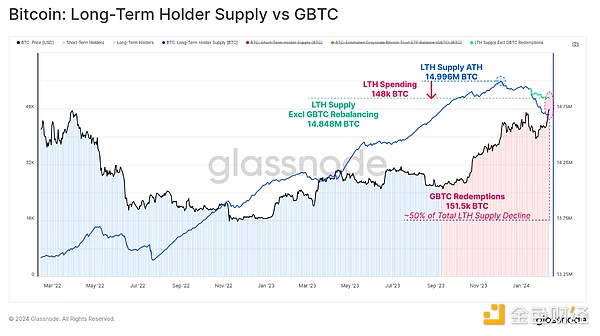
ETF in January Before the spot was approved, market speculation increased significantly. In response, many long-term holders (LTH) traded their Bitcoin, either to take a profit or to rebalance their holdings into one of the new ETF offerings.
In total, the LTH supply balance has decreased by approximately 299,500 BTC since its peak in November last year (14.996 million BTC).
However, we must also consider the GBTC product, which saw over 661,000 BTC inflows in 2021, classifying its holdings of supply as "long-term holder" status. Given that GBTC experienced an outflow of approximately 151,500 BTC, this suggests that the remaining 148,000 BTC of LTH supply can be attributed to LTH investors spending their Bitcoin. This is consistent with our previous research showing thatLTH tends to start distributing when the market approaches ATH price.
Supply Discovery
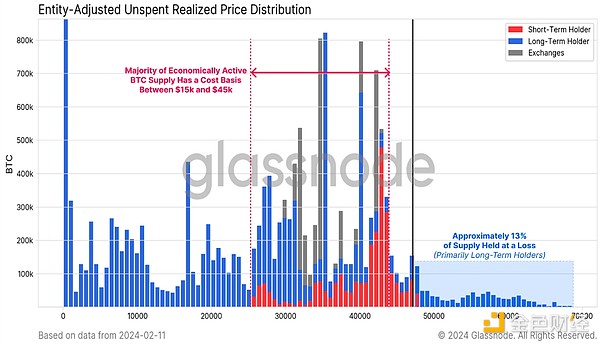
As the market moves higher, the vast majority of Bitcoins are now in the black. In fact, only 13% of the total supply was purchased above $48,000, thus making a loss.
The chart below shows the breakdown of BTC supply by purchase cost basis. We can see that the vast majority of Bitcoin (87%) was purchased for less than $48,000, with a large supply of short-term holders located between $40,000 and $45,000. Long-term holders dominated this 13% of loss supply, reflecting the “top buyers” across 141 trading days in 2021.
We can see , the total amount of LTH Supply currently in loss is 777.8k BTC, and it is trending towards the zero limit as the price rises. Therefore, only 6.5% of the total LTH supply is in the red.
Previously, losses in similar amounts of Bitcoin held by the LTH community corresponded to early bull market conditions (2019 was a controversial outlier).
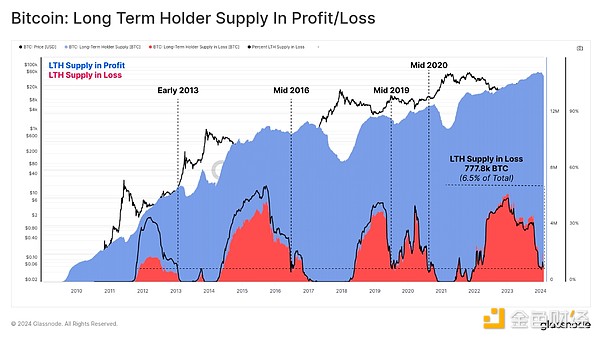
Another visualization The method is to lose the proportion of all supply held by LTH. At bear market bottoms, LTH tends to absorb the majority of unrealized losses as speculators are driven out of the market, resulting in a massive transfer of Bitcoin ownership to high-conviction holders.
In contrast, in the early stages of a bull market, this indicator tends to consistently reach lower lows as the market rises and takes profits on all LTH supply. The indicator appears to be following a similar pattern so far, briefly falling below 60% during the recent correction to $38,000.
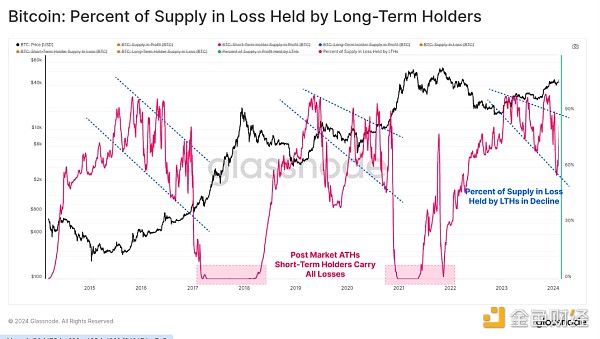
Short-term reset< /h2>
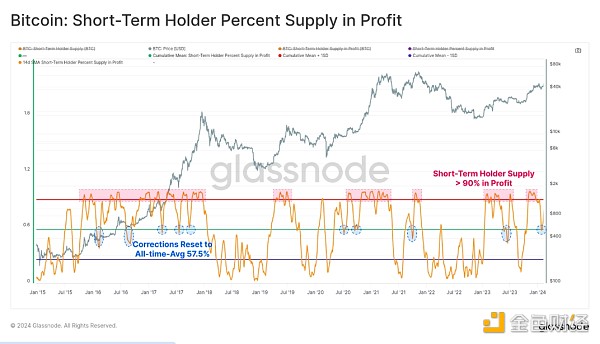
For the short-term holder (STH) community, the "sell news" correction following the ETF launch resulted in a healthy reset in multiple indicators.
First, We can see that STH supply as a percentage of profit dropped from a peak of about 100%, retest Its historical average is 57.5%. This means that almost half of STH supply is priced below its acquisition price, resulting in a healthy adjustment. Historically, this tends to correlate with local lows established when the market is in a macro uptrend.
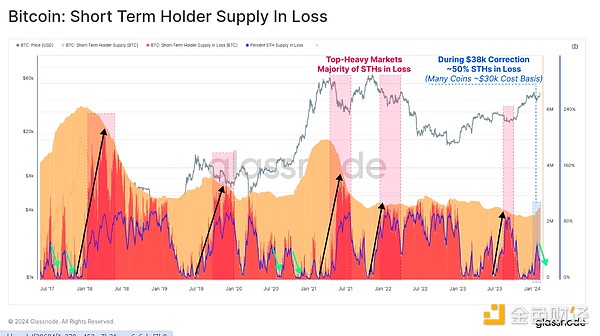
We can also see this in the next chart, which breaks down STH supply into volume held by profits (orange) versus losses (red). This helps us visualize and distinguish periods of increased risk from more "ordinary" corrections and pullbacks.
Typical correction conditions —— When STH supply is lost increases, but does not exceed approximately 60% of its holdings. This suggests that some new investors were stuck with an unfavorable cost base, but this was balanced out by many investors who bought at lower prices and still hold the tokens.
High Risk Situation - When supply losses of something increase sharply, usually to the vast majority of its total supply, this indicates that the market is in "Top-heavy" state. Many investors are now stuck with unfavorable acquisition prices.
By this metric, ETF "sell news" corrections appear to have more characteristics consistent with "ordinary" corrections.
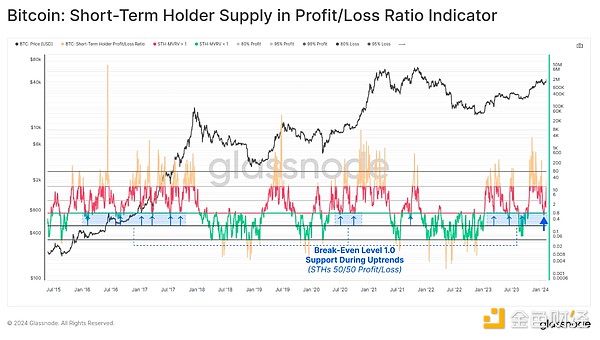
Finally, if we Calculating the ratio between STH supply and profit and loss, we can again determine an approximate textbook retest of breakeven level 1 (50:50 profit and loss split). In a strong and resilient uptrend, these balanced supply-of-something profitability points tend to form support.
Analysts can keep an eye on any deep breakout below this level, especially a turn towards resistance, as a sign that higher risk conditions are at play.
Summary
The patience and faith of long-term Bitcoin investors has paid off, with a very positive performance in 2023 and so far. Although BTC price is still 28% lower than ATH, the loss supply is rapidly decreasing at only 13%.
If we take into account the behavior of GBTC, long-term holders have traded around 148,000 BTC since November last year. This could signal a shift in investor behavior as profit-taking begins to increase as some Bitcoin is spent.
 JinseFinance


