Deep Bear and Noise Bull
True innovation takes time, but the market doesn't give that time; those who adhere to long-termism are eliminated, while those who take shortcuts are able to cash out and leave.
 JinseFinance

US equity financing has rebounded steadily from its 2023 lows and may accelerate significantly in the coming months: a batch of mega-IPOs are in the pipeline, with individual fundraising potentially reaching tens of billions of dollars. The market's most immediate concern is that these new stocks will "drain" funds from the existing US stock market, especially given that index funds and large-cap stock positions are already quite high.
SpaceX, OpenAI, and Anthropic "mega-IPOs" are flocking to the US stock market. SpaceX's prospectus (S-1) was officially disclosed last week, and its listing date is expected to be the second week of June, making it the first of the three companies to complete its public offering. OpenAI plans to list as early as September this year, significantly earlier than previously expected by the market, while Anthropic may seek listing as early as October this year.
According to TrendFocus, Deutsche Bank securities strategist Parag Thatte wrote in a report on May 22: "Within our demand-supply framework, a rebound in IPOs could indeed have a negative impact on stocks, but the impact would be mild; past academic literature and empirical evidence from IPO booms clearly show that IPO booms are usually accompanied by strong stock market returns because they occur during periods of strong stock demand." The core judgment of this study is not that "IPOs are harmless," but rather that "IPOs are not the main cause." Increased supply will bring short-term disturbances; the largest IPO, considered alone in the model, could drag down the market by about 1%; if the listing pace is concentrated and crowds out other stocks in the index benchmark, the impact could be greater. However, this is still more like a trigger for a common pullback than a sufficient condition for the end of a bull market. On average, the US stock market experiences a small pullback of more than 3% every 1 to 2 months, and there can be many triggers, with IPOs being just one of them. What truly supports this judgment is that demand hasn't collapsed. Households still have high cash balances, corporate profit growth is strong, equity funds are still seeing inflows, and share buyback announcements remain high. The problem isn't "whether there's enough money to buy new shares," but whether demand can continue to outpace supply; another boundary condition is that large-cap stocks, especially large-cap tech stocks, are already over-allocated, which is where the real sensitivity lies. This wave of IPOs looks large, but it's not an exaggeration when placed within the broader context of the US stock market. The quarterly pace of US equity issuance has risen from a low of approximately $30 billion at the beginning of 2023 to approximately $120 billion currently. In the coming months, a batch of mega-IPOs may push the pace even higher. Looking solely at IPOs, some upcoming large-scale projects could raise the equivalent of the total amount raised by all US IPOs in the past nine months. Expanding the scope to all US equity offerings, including secondary offerings, this is equivalent to approximately two months' worth of offerings. However, on another scale, the pressure is much less. Even the largest anticipated IPO will only raise slightly more than 0.1% of the current total market capitalization of the S&P 500. This is why "increased supply" alone is insufficient to conclude that "US stocks will inevitably fall": the absolute amount is striking, but not extreme relative to the market size. Historically, IPO booms have been more like a byproduct of bull markets. Over the past 30 years, the US stock market has experienced several cycles of rising equity issuance. Historically, the stock market has typically performed strongly during these phases: in the first three months after an IPO boom begins, the median return of the S&P 500 is approximately 8%; extending to 12 months, the return exceeds 20%. Exceptions are also clear: during the 2008-2009 global financial crisis, financial institutions and other entities were forced to raise capital, and the increase in issuance occurred amidst significant sell-offs. This type of "forced capital replenishment" is not the same as companies raising capital during periods of favorable valuations and demand in a normal market environment. Academic literature also leans towards this causal direction: a stronger stock market and higher expected profitability often precede an IPO boom; the issuance itself has a limited negative impact on the market during the same period. The more troublesome part is the latter half—after the wave of IPOs, stock market returns will eventually weaken, but this "event" can drag on for a long time and cannot be simply used as a short-term sell signal. The model estimates an impact of about 1%, but concentrated listings amplify the perceived impact. The demand-supply framework considers several forces together: changes in investor positions, stock fund inflows, buybacks, and IPOs. IPOs increase supply, and all other things being equal, this is naturally a negative factor. Calculations show that the largest IPO, viewed alone, could cause the market to fall by about 1%. If the listings are highly concentrated in time, or if new stocks squeeze out other constituent stocks after entering the index benchmark, the actual pressure may be greater. However, it's important to distinguish between "downside risk" and "systemic selling pressure." A pullback of more than 3% occurs on average every 1 to 2 months in the US stock market. An IPO boom might catalyze a pullback, but it doesn't necessarily change the market's direction. Unless demand weakens simultaneously, supply shocks are unlikely to independently crush the index. Demand is currently holding up: cash, earnings, and buybacks are all providing support. The household sector remains a key buffer. Cash balances accumulated during the pandemic are still high, with households holding approximately $3.3 trillion more in cash than the trend level from 2010 to 2019. Cash holdings relative to personal income are also high, allowing residents to allocate a larger portion of their new savings to financial assets, including stocks. Earnings are another supporting factor. The correlation between equity fund inflows and S&P 500 earnings growth has been approximately 54% since 2003. First-quarter earnings growth was described as one of the strongest in over 20 years, explaining why funds continue to follow equity assets. Buybacks are also a significant component of demand. Strong S&P 500 buyback announcements indicate that companies themselves are still providing buying pressure. Increased issuance brings supply, while buybacks and fund inflows provide absorption capacity; the current balance has not yet clearly shifted towards supply. Positioning is not universally overheated; crowding is mainly in large-cap technology stocks. Overall equity positioning is only slightly overweight, at the 53rd percentile since 2010. Active investors have even lower positions, around the 47th percentile, close to neutral; systematic strategies have slightly higher positions, around the 64th percentile. The real overcrowding is in large-cap stocks, especially large-cap tech. Large-cap stock allocation is at the 85th percentile, and large-cap tech reaches the 93rd percentile. This means that if an IPO boom triggers a rebalancing of funds, the sectors most likely to be targeted by the market are not "all stocks," but rather those already heavily held. The sector distribution is also uneven. Energy allocation is high, at the 87th percentile; large-cap growth and tech are slightly overweight overall. Financials are significantly underweight, at the 7th percentile; materials are even more extreme, at the 0th percentile. The US stock market is not a uniformly allocated market, and supply shocks will not be evenly distributed across every sector.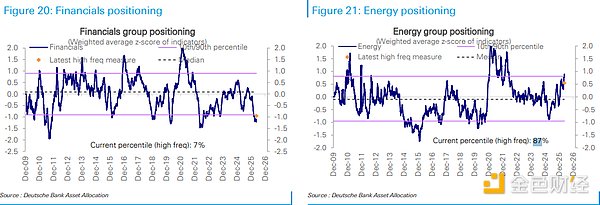
In the past week, equity fund inflows dropped to $2.4 billion, a significant slowdown. US equity funds still saw inflows of $9.5 billion, and broad global funds saw inflows of $10.3 billion, but significant outflows occurred outside the US.
Japanese equity funds saw outflows of $4.4 billion, the largest in five weeks; European outflows reached $2.3 billion, marking the sixth consecutive week of outflows; emerging markets saw outflows of $7.9 billion, also marking the sixth consecutive week of outflows. Among these, China-related funds saw outflows of $9.7 billion, while South Korea and Taiwan saw inflows of $3 billion and $1.7 billion respectively.
Industry funds are more concentrated.
Technology funds saw inflows of $9 billion, the largest in seven months. Meanwhile, bond funds saw inflows of $30.5 billion, rising to a five-month high. Funds weren't flowing unidirectionally into risk assets, but rather diversifying among US stocks, technology, and bonds. This is also the most noteworthy aspect of the IPO boom: not the number of new shares themselves, but whether demand continues to concentrate on a few strong assets. If earnings, buybacks, and US stock inflows continue to provide support, the IPO boom is more like short-term noise; if crowded positions in technology stocks loosen and stock inflows cool, the supply pressure will shift from a "model disturbance of about 1%" to a more difficult problem to digest.
True innovation takes time, but the market doesn't give that time; those who adhere to long-termism are eliminated, while those who take shortcuts are able to cash out and leave.
JinseFinanceIf compared with the market value of other mainstream assets, the top price range of Bitcoin is between 110,000 and 220,000 US dollars.
JinseFinanceDePIN, which stands for “Decentralized Physical Infrastructure Network,” uses blockchain technology to unite millions of participants to create and oversee trustless and permissionless infrastructure driven by programming.
JinseFinanceArmstrong predicts XRP to lead the 2024 crypto bull run, citing its strong team, marketing, community, and technological advancements.
 Alex
AlexBitcoin network activity is rising in a fashion similar to previous early-stage bull markets.
 cryptopotato
Industry experts believe Asian countries like Hong Kong will lead the new crypto bull run.
 Beincrypto
Crypto prices took a hike recently but while some are optimistic that the crypto bulls are returning, others feel that it is just a bull trap in a bull market. What is your perspective on this?
 Catherine
Star finance writer Matt Levine an entire BusinessWeek magazine issue to write about crypto. That may be game over for hard-line skeptics.
 Coindesk
Bitcoin investor and founder of software company MicroStrategy Michael Saylor are being sued for alleged tax fraud, according to a ...
 Bitcoinist
The new week has come with glad tidings for the price of bitcoin. After struggling to maintain above $20,000 for ...
Bitcoinist