Donald Trump Unveils 'MugShot' NFT Collection in Latest Venture
Trump debuts 'MugShot' NFTs, blending legal challenges, political aspirations, and crypto innovation in a unique collection capturing the first-ever mugshot of a U.S. President.
 Hui Xin

Author: Token Terminal; Translator: Peggy, BlockBeats
This Token Terminal Ethereum Q1 2026 report presents a set of seemingly contradictory yet crucial data: Ethereum mainnet users, transaction volume, and throughput all reached record highs, but transaction fees, TVL, transaction volume, and ETH fully diluted market capitalization declined sequentially.
Ethereum is actively entering a phase of "trading scale for low fees." As the Fusaka upgrade increases data capacity and block space becomes cheaper, user and transaction growth is accelerating, but short-term fee capture is suppressed. The report interprets this phenomenon as the Jevons Paradox: when usage costs decrease, network demand may be further released.
More noteworthy is that Ethereum's core narrative is shifting from a DeFi public chain to a global financial settlement layer.
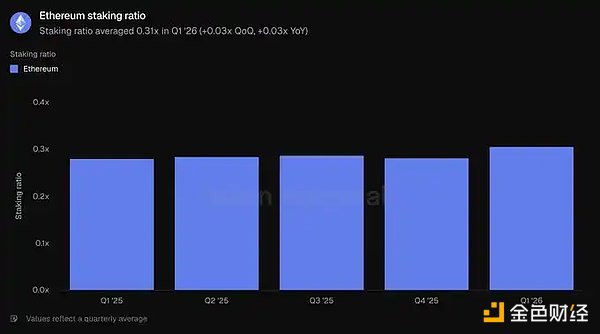
The report shows that Ethereum still dominates the tokenized asset space: stablecoins, tokenized funds, tokenized commodities, and tokenized stocks have all achieved scale on it, with funds and gold-like assets showing particularly significant growth. The continued entry of institutions such as BlackRock, JPMorgan, and Fidelity has also propelled "institutional on-chain" from concept to product issuance and settlement practice. The core value of this report lies not in proving how the price of ETH will change in the short term, but in demonstrating Ethereum's structural position as financial infrastructure: it sacrifices short-term transaction fees through scaling while attempting to solidify its network effects in stablecoins, tokenized funds, on-chain lending, and institutional settlement. For investors and industry observers, the real question is: as more and more financial assets are moved on-chain, who will become the default settlement layer, and how will this settlement demand ultimately translate into ETH's value capture? The following is the original text: 1) Execution Summary Ethereum ($ETH) is a public, permissionless blockchain that provides global settlement and computing power for financial applications in an open economy. It runs a shared ledger that anyone can build on and that no single party can shut down, and uses its native asset, ETH, to pay transaction fees; at the same time, ETH is also used to ensure network security through a staking mechanism. The activities carried by Ethereum have historically been limited by the cost and throughput of traditional financial infrastructure: settlement takes several days to complete, with layers of intermediaries, and each hop carries counterparty risk. Tokenization and stablecoins are on-chain solutions that have emerged to address these frictions. As the regulatory frameworks for both mature in 2025 and into 2026, the conditions for institutional-grade on-chain activities are moving from theory to reality. Ethereum's role in this transformation is that of a foundational settlement layer. Stablecoins, tokenized funds, tokenized commodities, and an increasing number of tokenized stocks are being issued and settled on Ethereum; meanwhile, layer-2 networks are responsible for scaling throughput and ultimately settling transactions back to layer one. ETH accumulates value as the asset that secures and pays for this settlement activity, while the staking market reflects how much ETH supply is being contributed to this role. From a market positioning perspective, Ethereum remains the largest venue for tokenized assets by market capitalization. In cross-chain terms, Ethereum holds a majority share in categories such as stablecoins, tokenized funds, commodities, and stocks. Ethereum is driven by the Ethereum Foundation and a broad, independent community of client teams and researchers; meanwhile, institutional organizations like Etherealize are helping traditional finance better understand the network. The first quarter of 2026 can be clearly divided into two main themes. On the one hand, usage hit record highs: monthly active users, number of transactions, and throughput all broke records. On the other hand, dollar-denominated value and fee metrics contracted: fully diluted market capitalization, total value locked, trading volume, and both types of fee metrics all declined sequentially. Key events shaping this quarter impacted both of these main trends: the second Blob Parameters Only (BPO #2) fork in the Fusaka upgrade cycle increased data capacity in January; ERC-8004 went live on the mainnet in February, becoming the standard for AI Agent identity and reputation; the Ethereum Foundation identified its 2026 Protocol Cluster priorities: scaling, improving user experience, and strengthening the Layer 1 network; and events such as the Institutional Ethereum Forum in March also reflected increased institutional participation. Key Metrics (Q1 2026) Total Value Locked in the Ecosystem: $316.2 billion (QoQ -11.0%, YoY +22.8%) Active Loans in the Ecosystem: $21.8 billion (QoQ -16.6%, YoY +39.0%) Ecosystem Transaction Volume: $134.5 billion (QoQ -24.0%, YoY -31.2%) Ecosystem Fees: $2 billion (QoQ -16.9%, YoY -7.8%) Tokenized Asset Market Cap: $203.4 billion (QoQ -0.7%, YoY +42.9%) Stablecoins: $1789 $19.4 billion (QoQ -2.3%, YoY +37.6%) Tokenized Funds: $19.4 billion (QoQ +4.9%, YoY +73.1%) Tokenized Commodities: $4.7 billion (QoQ +60.0%, YoY +325.9%) Tokenized Equities: $365.1 million (QoQ +16.5%) Monthly Active Users: 13.2 million (QoQ +53.5%, YoY +85.9%) Transactions: 200.4 million (QoQ +38.0%, YoY +81.5%) Transactions per Second: 25.78 (QoQ +41.2%, YoY +325.6%) Fees: $39.9 million (down 47.9% QoQ, down 81.9% YoY) Fully Diluted Market Cap: $290 billion (down 30.3% QoQ, down 9.9% YoY) Staking Ratio: 0.31x (up 0.03x QoQ, up 0.03x YoY) Token Holders: 292.8 million (up 8.1% QoQ, up 24.9% YoY) This report covers Ethereum Layer 1 network, i.e., the mainnet. Layer 2 networks are considered independent chains and are not included in Ethereum's data.
Total Value Locked (TVL) measures the on-chain deposit value across various applications of a project, and is a leading indicator of income-generating activities such as lending, trading, and staking. This statistic represents the capital deposited into the Ethereum ecosystem, which depositors can typically withdraw at any time.
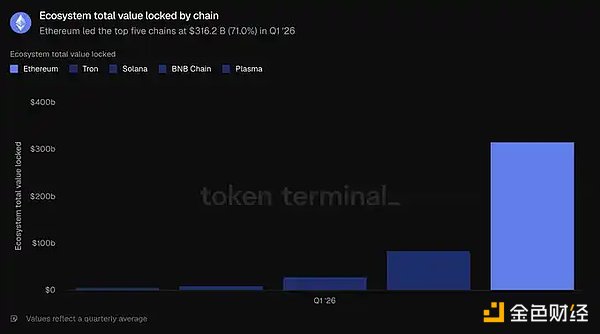
According to this metric, in the first quarter of 2026, the average TVL was $316.2 billion, a decrease of 11.0% quarter-over-quarter, but an increase of 22.8% year-over-year. The quarterly decline is consistent with the overall drop in asset prices, while the annual growth indicates that the Ethereum ecosystem has significantly expanded compared to a year ago.
Among the top five blockchains, Ethereum leads by a wide margin with $316.2 billion, surpassing the combined total of Tron ($84.5 billion), Solana ($28.8 billion), BNB Chain ($10.3 billion), and Plasma ($5.7 billion), accounting for 71.0% of the total capital of the top five blockchains. The largest pools of this capital are concentrated in the liquidity staking sector, represented by Lido, and the lending sector, represented by Aave. Restaking projects EigenLayer and ether.fi, as well as synthetic dollar issuers Ethena and Sky, are also among the largest applications. Capital concentration remains Ethereum's clearest structural advantage.
Active lending measures the portion of deposits that has been lent to borrowers and thus accrues interest; this metric is typically correlated with lending income. On Ethereum, it reflects the outstanding loans across the entire ecosystem's lending applications.
In the first quarter of 2026, the average active lending in the ecosystem was $21.8 billion, a 16.6% decrease quarter-over-quarter and a 39.0% increase year-over-year. The outstanding loan balance contracted along with the total value locked, consistent with declining risk appetite, but still significantly higher than a year ago.
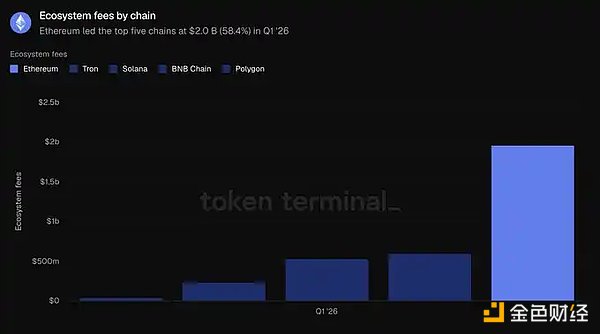
Lending activity on Ethereum is concentrated in a few money markets, with Aave dominating. At the end of the quarter, Aave had approximately $13.5 billion in active loans, representing the majority of the ecosystem; followed by Morpho ($1.9 billion), Sky's Spark ($1 billion), and Maple ($840 million). The contraction this quarter was primarily driven by Aave, whose loan book shrank by approximately 24% during the quarter as prices fell and borrowing demand cooled. Among the top five blockchains, Ethereum's $21.8 billion significantly surpasses Solana ($2.5 billion), Plasma ($2.1 billion), BNB Chain ($760.8 million), and Avalanche ($392.4 million), accounting for 79.2% of the total market capitalization of the top five chains. This is the highest share of Ethereum among all the metrics in this section. Trading volume measures the total value of transactions executed on decentralized spot exchanges. Since traders need to pay fees, this metric is typically related to the fees generated by these exchanges. The statistics here represent the total trading volume of DEXs within the Ethereum ecosystem. In the first quarter of 2026, the total trading volume of the Ethereum ecosystem reached $134.5 billion, a decrease of 24.0% quarter-over-quarter and 31.2% year-over-year. The decline in trading volume was more pronounced than the decrease in locked capital, indicating a reduction in risk appetite during the quarterly pullback. Ethereum's DEX activity is concentrated in a few deep trading venues. Uniswap processed approximately $85.5 billion in trading volume in the first quarter, accounting for about two-thirds of the ecosystem's total trading volume; followed by Curve ($22.1 billion) and CoW Swap ($12.4 billion). Transaction volume is also the only metric in this section where Ethereum failed to lead across chains: BNB Chain's transaction volume was $162.5 billion, higher than Ethereum's $134.5 billion; Solana followed closely with $104.9 billion; then came Avalanche ($14.5 billion) and Polygon ($10.7 billion). Ethereum accounted for 31.5% of the transaction volume in the top five chains, ranking second, lower than BNB Chain's 38.0%. Fees measure the total value paid by users for using a particular application, such as interest paid by borrowers and transaction fees paid by traders, reflecting how much economic value is generated. This metric summarizes the fees generated by applications in the Ethereum ecosystem. In the first quarter of 2026, total ecosystem fees amounted to $2 billion, a 16.9% decrease quarter-over-quarter and a 7.8% decrease year-over-year, consistent with weakening trading and lending activity. Ethereum generated $2 billion in fees, significantly higher than Tron ($599.3 million), Solana ($532.5 million), BNB Chain ($231.9 million), and Polygon ($38.8 million), accounting for 58.4% of the total fees for the top five chains. Despite the decline, Ethereum remains the single largest source of application fees. Overall, Ethereum leads in locked capital, credit, and fees, lagging only in trading volume.
The market capitalization of circulating assets measures the total value of an asset after it has been tokenized on the blockchain. It is calculated by multiplying the circulating supply by the closing price at the end of the day. For stablecoins, it refers to the outstanding supply; for tokenized funds, it refers to the assets under management on the blockchain; for tokenized stocks, it refers to the value of the stocks issued on the blockchain. The statistics here are for assets issued on Ethereum.
In the first quarter of 2026, the average market capitalization of tokenized assets on Ethereum was $203.4 billion, basically flat compared to the previous quarter (-0.7%), and up 42.9% year-over-year.
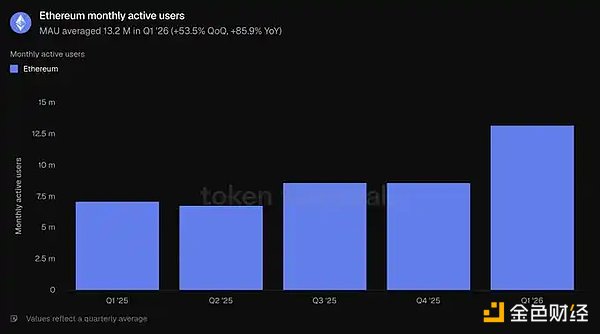
Stablecoins accounted for the largest share, reaching 87.9% of the total, with the remainder consisting of funds, commodities, and stocks. In the first quarter of 2026, the average size of stablecoins on Ethereum was $178.9 billion, a 2.3% decrease quarter-over-quarter but a 37.6% increase year-over-year, making it the only sub-segment to decline during the quarter. Two major issuers dominated: at the end of the quarter, Tether's USDT was $94.1 billion and Circle's USDC was $54.5 billion, together accounting for the majority of the network's stablecoin market capitalization. Following them were Sky's USDS ($12.4 billion), Ethena's USDe ($5.9 billion), and PayPal's PYUSD ($2.9 billion). Newer, regulated entrants like Ripple's RLUSD ($1.1 billion) have also launched. Among the top five chains, Ethereum leads with $178.9 billion, surpassing Tron ($84.5 billion), Solana ($14.5 billion), Arbitrum One ($6.8 billion), and Base ($4.7 billion), accounting for 61.8% of the total value of the top five chains. In the first quarter of 2026, the average size of tokenized funds on Ethereum was $19.4 billion, a 4.9% increase quarter-over-quarter and a 73.1% increase year-over-year. This sector can be divided into two parts: one is the leading interest-bearing on-chain USD, represented by Sky's sUSDS (approximately $6.4 billion) and Ethena's sUSDe (approximately $3.5 billion); the other is the regulated funds supporting institutional narratives, which have achieved significant scale, including BlackRock's BUIDL (issued through Securitize, approximately $1 billion), WisdomTree's Government Money Market Fund (approximately $815 million), and Superstate's USTB (approximately $620 million), with Ondo's OUSG (approximately $320 million) following closely behind. Among the top five chains, Ethereum ranks first with $19.4 billion, ahead of zkSync Era ($2.5 billion), BNB Chain ($2.3 billion), Solana ($1.3 billion), and Stellar ($1.1 billion), accounting for 73.0% of the total value of the top five chains, making it the second most concentrated asset class in this section. In the first quarter of 2026, the average size of tokenized commodities on Ethereum was $4.7 billion, representing a 60.0% increase quarter-over-quarter and a 325.9% increase year-over-year, making it the fastest-growing category of tokenized assets. This category is almost entirely composed of gold: Tether Gold (XAUT, approximately $2.6 billion) and Paxos' PAX Gold (PAXG, approximately $2.4 billion) together make up almost the entire sector. Among the top five blockchains, Ethereum's $4.7 billion far surpasses XRP Ledger ($736.6 million), Arbitrum One ($95.9 million), BNB Chain ($38.4 million), and Solana ($29.8 million), accounting for 84.0% of the total value of the top five blockchains, making it Ethereum's strongest lead in this section. Tokenized shares remain the smallest category. In the first quarter of 2026, the average size of tokenized shares on Ethereum was $365.1 million, a significant increase from a negligible base a year earlier, and a 16.5% increase quarter-over-quarter. This category is almost entirely dominated by Ondo Finance. Ondo's on-chain stocks and ETFs cover broad-based index funds such as the S&P 500 and Nasdaq 100, as well as dozens of individual stocks, constituting the majority of the market capitalization of tokenized stocks on Ethereum. Among the top five chains, Ethereum leads with $365.1 million, followed by Solana ($249 million), BNB Chain ($150.5 million), Arbitrum One ($29 million), and Stellar ($4.2 million). However, Ethereum only accounts for 45.8% of the total market capitalization of the top five chains, its narrowest lead and the only tokenized category where Ethereum does not hold a clear majority. Overall, this quarter demonstrated Ethereum's leading position in the fund and commodity tokenization space, even with stablecoin balances temporarily stagnating. 4) Usage Monthly active users (MAUs) measure the number of unique addresses that engage in revenue-generating transactions with the network within a one-month window. On Ethereum, it counts different addresses transacting on a Layer 1 network. In Q1 2026, MAUs averaged 13.2 million, a 53.5% increase quarter-over-quarter and an 85.9% increase year-over-year, setting a new record. After several quarters of relatively moderate growth, user growth accelerated significantly.
Transaction count measures the number of transactions confirmed and added to the blockchain, reflecting user activity on the network; transactions per second (TPS) is the average rate at which these confirmed transactions occur, used to measure throughput and real-time usage. Both metrics here refer to the Ethereum Layer 1 network.
In the first quarter of 2026, the total number of transactions reached 200.4 million, a 38.0% increase quarter-over-quarter and an 81.5% increase year-over-year; throughput increased to 25.78 TPS, a 41.2% increase quarter-over-quarter. Both metrics reached record highs, confirming that user growth translated into a substantial increase in on-chain activity ...>
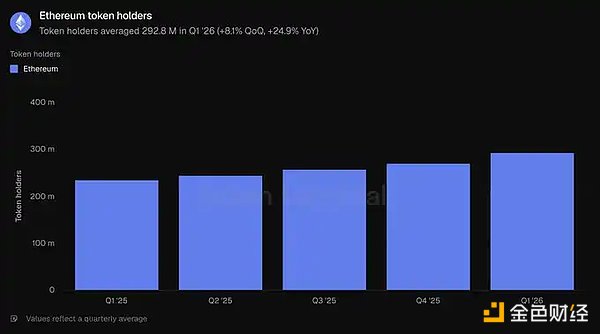
Token holders measure the number of different addresses holding a network's native token. On Ethereum, it counts addresses holding ETH.
In the first quarter of 2026, the average number of token holders was 292.8 million, representing an 8.1% increase quarter-over-quarter and a 24.9% increase year-over-year, continuing the steady upward trend of the past five quarters. Even with a decline in fully diluted market capitalization, the holder base continued to expand, indicating that ETH ownership continued to become more widespread during price pullbacks. ...>
"The most prominent tension this quarter is that Ethereum mainnet usage hit an all-time high, but transaction fees are declining. Ethereum is intentionally sacrificing short-term fee capture to expand the network, betting that cheaper block space will unlock more demand and ultimately bring more network revenue in the long run.
Token Terminal's "Ethereum Q1 2026 Report" shows that this bet is working. On a year-over-year basis, monthly active users increased by 85.9%, transaction volume increased by 81.5%, and throughput increased.
81.7%. This is precisely the Jevons Paradox at work. We expect the increase in total network demand to be enough to offset the impact of lower fees, similar to how the semiconductor industry generates revenue today that is orders of magnitude higher than in 1975, when Intel co-founder Gordon Moore observed that the number of transistors on a microchip roughly doubled every two years. Furthermore, the returns from scaling are still ahead: the Glamsterdam upgrade plan will increase the gas limit by more than 3 times in the third quarter, while the Ethereum roadmap points to 10,000 TPS by 2029, and a 'fast layer' network with second-level finality. We agree with BlackRock CEO Larry Fink's assessment last December. He wrote, "Today's tokenization is roughly equivalent to the internet in 1996—when Amazon only sold $16 million worth of books." At the time, the consensus was that Amazon was just a loss-making online bookstore propped up by the dot-com bubble. However, Jeff Bezos... Seeing that the internet would reshape retail, companies prioritized optimizing network effects and economies of scale over short-term profits. Ethereum is making a similar trade-off to solidify its position as the global financial settlement layer. Another lesson from the internet is that open, permissionless networks often triumph over closed networks. In 1995, Bill Gates published *The Road Ahead*, predicting that digital commerce would run on proprietary enterprise networks he called the "information superhighway," not the open internet. Microsoft was building MSN at the time. AOL, CompuServe, and Prodigy operated walled gardens with millions of paying users. France's Minitel had more users than the entire World Wide Web until the end of 1996. They all ultimately lost. No serious company wanted to build on a network controlled by competitors; perhaps more importantly, no company could keep up with the pace of permissionless innovation indefinitely. We have seen this repeatedly: Linux surpassing proprietary Unix, open networks replacing walled gardens, Wikipedia replacing… Britannica. Every time, proprietary solutions start with a head start—more focused products, stronger marketing, and more established business development teams—but every time, this lead is eroded as open systems cross the thresholds of contribution accumulation, tool maturity, and trust neutrality. Today, we are seeing the same theme in financial infrastructure, and the data in this report proves that Ethereum has crossed this threshold and holds a dominant market share across all key metrics. Institutions building tokenized finance choose Ethereum not out of ideology, but because liquidity, composability, and institutional precedent are already there. As this report highlights, among the top five chains, Ethereum accounts for 79.2% of active DeFi lending, 61.8% of stablecoins, 73.0% of tokenized funds, and 84.0% of [other blockchains/chains]. Tokenized commodities. Each new tokenized asset deepens liquidity, attracting the next asset to follow; a neutral underlying is the only sustainable equilibrium, as large players will never agree to settle on a competitor's infrastructure. Furthermore, institutions are realizing that privacy, permissioning, KYC, and transfer restrictions can all be achieved on Ethereum through privacy-preserving environments and permissioned token standards, without sacrificing access to public liquidity; conversely, grafting public liquidity and open application ecosystems onto closed chains is impossible. If anything, institutional momentum accelerated further after the quarter. In May alone, BlackRock applied for two more tokenized funds; JPMorgan launched its second tokenized money market fund, JLTXX, on Ethereum; and Fidelity International launched FILQ, a Moody's AAA-rated USD liquidity fund issued in ERC-20 form. In the stablecoin space, the Japan Blockchain Foundation's Japanese yen stablecoin, EJPY, will launch on Ethereum; a consortium of twelve European banks, including BNP Paribas, will also launch its fund. Paribas, ING, UniCredit, and BBVA are also preparing to launch a regulated euro stablecoin. The internet seemed impossible in 1990, but by 2005 it seemed inevitable. If Fink's assessment of the current stage of tokenization is correct, the next few years could be one of the most exciting periods in Ethereum's history. As we argued in our "Productive Money" report, network fees provide an intrinsic value floor for ETH, and a bull market scenario would see ETH absorbing the over $30 trillion in monetary premium held by gold and Bitcoin because ETH possesses superior monetary attributes. ETH does not need to rely on high fees to win. 7) Definitions: Total Value Locked in the Ecosystem: The USD value of assets deposited by various applications within a given blockchain ecosystem, reported as an average over the period. **Ecosystem Active Loans:** The outstanding USD value of loans within the ecosystem's lending applications, reported as a period average. **Ecosystem Transaction Volume:** The USD value of transactions executed on decentralized exchanges within the ecosystem, reported as a period total. **Ecosystem Fees:** The total fees paid by users to applications within the ecosystem, reported as a period total. **Circulating Asset Market Cap:** The circulating USD value of a tokenized asset class, calculated by multiplying the circulating supply by the daily closing price, reported as a period average. **Monthly Active Users:** The number of different addresses engaging in revenue-generating transactions with Ethereum, reported as a monthly average. **Number of Transactions:** The number of transactions confirmed and settled on the Ethereum Layer 1 network, reported as a period total. Transactions per second: The average rate at which transactions are confirmed on the Ethereum Layer 1 network during the period. Fees: Total transaction fees paid on the Ethereum Layer 1 network, reported as total supply during the period. Fully Diluted Market Cap: ETH price multiplied by the total supply under the current token economic model, reported as the average during the period. Staking Ratio: The proportion of staked ETH used to secure the network relative to the total ETH market capitalization, reported as the average during the period. Number of Token Holders: The number of different addresses holding ETH, reported as the average during the period. 8) About this Report This report is published quarterly and is produced based on Token Terminal's end-to-end on-chain data infrastructure. All metrics are derived directly from blockchain data. The charts and datasets cited in this report can be viewed in the corresponding Ethereum Q1 2026 report dashboard on Token Terminal.
Trump debuts 'MugShot' NFTs, blending legal challenges, political aspirations, and crypto innovation in a unique collection capturing the first-ever mugshot of a U.S. President.
Hui XinChina's Blockchain-based Service Network (BSN) is set to introduce RealDID, a groundbreaking initiative led by the Ministry of Public Security, for its 1.4 billion citizens. The scheme aims to establish the world's first national-level decentralised identity system, impacting the identity verification landscape.
 Joy
JoyTerra co-founder Do Kwon confronts extended Montenegro detention amid extradition, intertwining with Terra's 2022 collapse fallout in the crypto market.
Hui XinA former spy turned hitman, Lee Kyung-woo, was sentenced to life in prison for a heinous crime that unfolded like a K-drama plot in an upscale district of Seoul. The victim, a woman involved in a collapsed cryptocurrency called PURE, was kidnapped, drugged, and murdered over a crypto dispute.
JoyAmidst the sea of uncertainties surrounding the 2024 U.S. stock market, Wall Street's divergent opinions offer investors very little guidance in the volatile markets.
 Brian
BrianIn their quest for the world's most lucrative assets, investors often seek a surefire strategy to accumulate wealth. Is there truly a fail-safe investment that guarantees returns without risks?
BrianIn response to the FTX collapse, the CFTC proposes a rule to prevent the commingling of customer funds in derivatives trading, enhancing protection in the financial market.
 YouQuan
Until now, cryptocurrency assets were considered indefinite-lived intangible assets under Generally Accepted Accounting Principles (GAAP).
BrianOpenAI partners with Axel Springer to integrate AI into journalism, aiming to enhance news access and accuracy while navigating challenges of misinformation and the need for human oversight.
YouQuanHitachi and Concordium are developing a biometric crypto wallet in the proof-of-technology stage, enabling secure access through fingerprint or facial scans.
Hui Xin